The United States Is Failing To Reduce CO2 Emissions
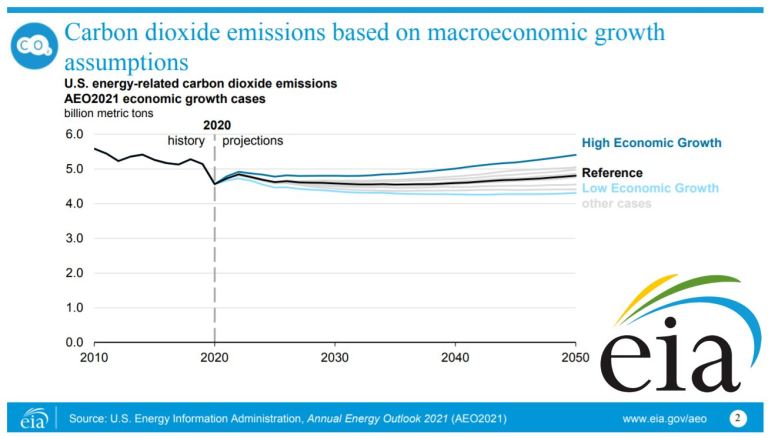
The US government’s Energy Information Administration (EIA) Annual Report projects United States CO2 emissions, from all energy sources, to remain approximately constant over the next 30 years, as shown below. In other words, according to the US gov’t, the US is not reducing CO2 emissions toward zero. This is based on current gov’t policy. If policy changed slightly, the below curve would change too, yet only slightly. This model is helpful to lawmakers, since it enables them to see the effects of possible policy changes.
EIA assumes consumers satisfy demand at lowest cost, which is consistent with past observations. They see PV solar farm and land-based wind power as being similar in cost to carbon-based options, and therefore expects them to move forward, to an extent. They also expect more-costly sources, such as offshore wind, to not be cost-reduced below carbon options during the next few decades.
Decarbonizing entails transitioning from energy that emits CO2, to energy that doesn’t. Typically this involves replacing oil, coal, and natural gas; with hydro, solar, wind and nuclear power. After 30 years of decarbonization, in 2050, EIA estimates 53% of US electricity to be green (20% solar, 14% wind, 6% hydro, 11% nuclear). And since ~42% of all energy is electricity, 22% of all US energy would be green, and 78% would still emit CO2 (42% * 53%).
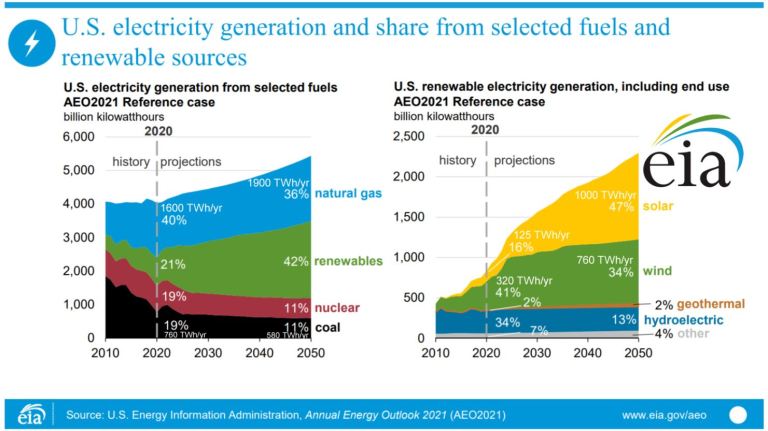
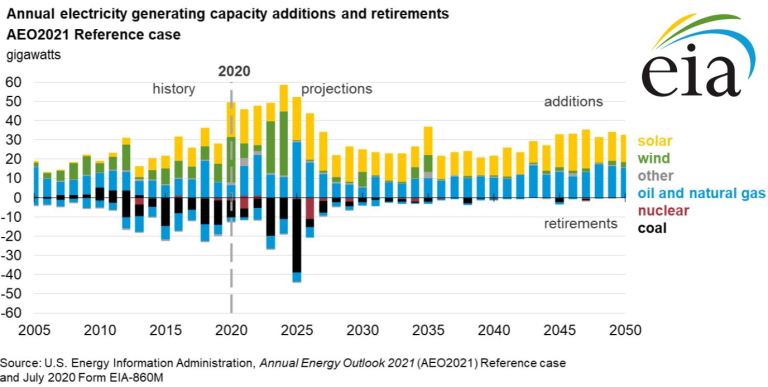
EIA is not estimating exponential growth from solar and wind power over the next 30 years. Instead, over 30 years, solar is expected to increase from 3% to 20% of total electricity, and wind power is expect increase from 8% to 14%, as shown below. Wind construction (green bars below) stop after 2024 due to an expired wind tax credit. If this credit is extended, one can expect more wind, however not enough to solve our problems.
Why We Are Failing
The US and others are failing for many reasons, several of which are listed below. Understanding these is important, since they are the obstacles that need to be overcome.
- There is no national plan for how to get to zero emission; subsequently, gov’t engineers and economist do not know what to do, and gov’t has no way of evaluating decarbonization performance each year.
- One can expect communities near deserts to build up PV solar farms until they discard green electrons at mid-day. If one reaches the point of dumping green after scaling solar to 1/3rd of total electricity, and 42% of all energy is electricity, then those communities would get 14% of total energy from solar, for example (42% / 3). In other words, that desert community would still emit CO2 from 86% of their energy consumption, after reaching solar saturation (100% – 14%).
- One can add wind power to solar power, and possibly get 85% of total electricity from wind and solar over a year; however, this still leaves 64% of total energy fulfilled by carbon-based sources (1 – 42% * 85%).
- There are reports that PV solar farms and wind farms are cheaper than carbon-based sources. However, these assume one is building two facilities from scratch, and comparing the cost of each. On the other hand, the typical case is a carbon plant has already been built, and one is looking at adding an intermittent solar or wind facility. This entails reducing the output of the carbon plant, and substituting green electrons as they become available. Consequently, the carbon plant’s fixed costs are spread out over less output, which means the cost of its electricity increases. For example, decreasing the output from 87% to 51% of full capacity might cause the cost of produced electricity to increase from $0.032 to $0.037/kWh. Also, one might need $0.005/kWh for additional power wires to connect distant green to consumer. In summary, adding a green source can be done; however, making it economically viable often requires gov’t intervention that increases consumer price, and/or decreases tax revenue.
- Residential PV is approximately 3 times more costly than PV solar farm; and commercial building PV is approximately 2 times more costly than PV solar farm, in $/kWh units. When one looks at the costs of transmission, and the cost of land for solar farms, residential/commercial based PV sometimes seems more attractive. However, this is misleading, since PV buildings rely on external transmission and carbon-based generation infrastructure when the sun sets, and this equipment costs money to maintain.
- The world needs electricity, yet also needs a similar amount of energy to make things, such as metals, plastics, chemicals and cement. And, doing this with direct heat, instead of via electricity, is less costly. In other words, very hot sources of green energy are probably needed. And there are only two: nuclear and concentrated solar. In other words, resolving climate change might require cost-reduction and mass production of nuclear and/or concentrated solar, as discussed in Turning Deserts into Factories. PV solar and wind power do not create heat directly, and therefore may never be able to make metals, plastics, chemicals etc; cheaper than carbon-based options.
- US and European nuclear power currently cost $80/MWh ($0.08/kWh). However, this refers to designing, certifying and building each facility one at a time; which requires employing thousands of personnel for many years. Alternatively, mass producing one design would see a different cost structure. The Chinese HTR-PM generation 4 nuclear reactor, for example, is up and running and produces electricity at $0.034/kWh ($2.30/Watt) in China. In theory, this specific design could be factory mass produced, at less cost, as discussed in How the US Gov’t can Solve the Climate Change Problem for $100B. However, setting up factory mass production for nuclear power might take 10 years. For details on how that might work, see Global Decarbonization Plan.
- Hydroelectric dams are dependent on land conducive to the task, which means one builds easiest first, and it gets harder as one builds. Same with both offshore and land-based wind. The London Array is in 25m of water, and a water depth map around England does not show many windy opportunities close to shore at that depth. As one builds, they should expect both water depth and distance from shore to increase; which increases costs.
- Land-based windmills need windy land away from people, yet not too far from large population centers. Wind maps show the US Rocky Mountains as a prime location for wind power; however, placing a large windmill on a snow covered mountain is costly. Windmills need to be kept away from homes, which rules out large amounts of land. And windmills in remote regions, far from heavy power wires, are more costly.
- GDP typically increases each year, and this causes energy consumption to increase, which leads to more CO2.
EIA Ignores Most of the Green Gadgets You See on YouTube
The following graph shows the cost to generate electricity from different sources, without emitting CO2, in $/MWh units, according to NREL’s 2021 USA ATB Model.
The blue dotted line shows the current cost of US electricity from natural gas, which is approximately $40/MWh ($0.04/kWh). EIA is not expecting items to the right of this line to be cost-reduced below carbon during the next few decades; and therefore, for the most part, ignores them.
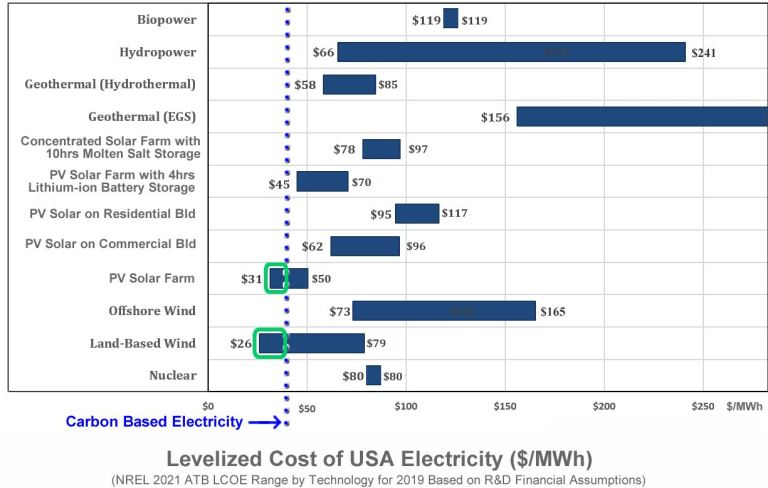
There are many things one can do to create green energy; however, in most cases, their costs are higher than carbon-based options; and are therefore not scalable. In other words, political pressure might cause a community to build something costly; however, mass deployment is not feasible due to the public’s desire to not increase energy costs appreciably. EIA observes this consumer and political behavior, and factors it into their model.
How to Decarbonize the USA over 30 years
We will now look at what it takes to decarbonize all energy in the US at a constant rate of 2.8% each year, over 30 years ((100% – 16%) / 30yrs). As a result, CO2 emissions, shown in red below, decrease to zero, and disruption is spread out somewhat evenly.
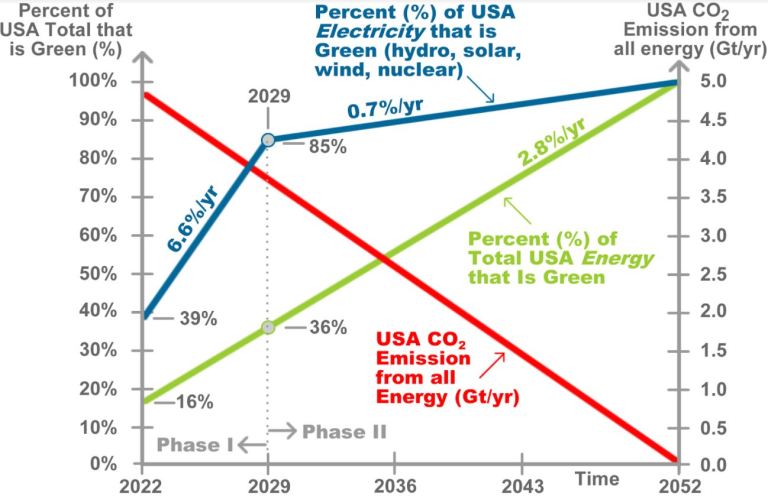
We break up decarbonization into two phase. Phase I is 7 years and we know what to do; whereas Phase II is 23 years and we don’t have a clue. However, during Phase I, engineers have 7 years to get a handle on Phase II.
Phase I decarbonizes electricity from 39% to 85% that does not emit CO2; which entails 6.6% of electricity going green each year. In absolute terms, this means we need to build 300 TWh/yr, each year, of hydro, wind, solar and/or nuclear power. The lowest cost way to do this is to replace electricity from natural gas and coal fired power stations, with electricity from PV solar farms and land-based wind farms. And maintaining the 6.6%/yr electricity decarbonization rate requires solar farm and wind farm construction to increase approximately 7-fold.
After ~7 years of Phase I construction, saturation will probably cause the US to pursue other decarbonization opportunities. Saturation involves discarding green electricity when supply exceeds demand, on a sunny windy day.
How to Increase Solar/Wind Construction 7-fold
To add 300 TWh/yr, one might add 100 TWh/yr of PV solar power each year, and add 200 TWh/yr of land-based wind power each year. The ratio of these two is not important, since what matters is maintaining the total. Then, after ~7 years, 85% of US electricity would be green, and 36% of US energy would be green.
NREL estimates PV solar farm construction cost at $1.36/Watt, which means 100 TW/yr of solar would cost $52B each year ($1.36 * (100 TW * 1000) / (24 hrs * 365 days * 30% CP)). And they estimate wind power construction at $1.37/Watt, which means 200 TW/yr of wind would cost $76B each year ($1.37 * (200 TW * 1000) / (24 hrs * 365 days * 41% CP)).
Gov’t does not pay $52B or $76B each year. Instead, capital markets lend, contingent on having customers. And customers are available, provided the green option is cheaper than carbon, which it is with PV solar farm and land-based wind, given a little boost from gov’t intervention.
One can view a list of solar farms to get a sense of what 100 TWh/yr of solar looks like. For example, one could get 100 TWh/yr by building 60 Solar Stars (100 / 1.66). Also, one can view a list of wind farms to get a sense of what 200 TWh/yr of wind looks like. For example, one could get 200 TWh/yr by building 63 Alta Farms (200 / 3.18).
In 2020, 39% of US electricity was green (3% solar, 8% wind, 19% nuclear, 7% hydro); and 16% of all energy was green. After 7 years of 6.6%/yr green power construction, in 2029, 85% of US electricity would be green (19% solar, 40% wind, 18% nuclear, 6% hydro); and 36% of all energy would be green, for example.
Between 2016 and 2019, the US added ~14 TWh/yr of solar each year, and added ~28 TWh/yr of wind each year. To support 6.6%/yr electricity decarbonization for 7 years, one would need to increase these approximately 7-fold (~100 TWh/yr = 14 * 7, ~200 TWh/yr = 28 * 7). This is doable, as discussed in How to Accelerate Green Electricity.
If one wants to rework the above calculations with their own numbers, download our spreadsheet and see “Plan to Get the USA to Zero CO2 Emissions” within worksheet “Plan”.
A Plan to Get to Zero CO2 Emissions
Bill Gates stated we need a plan that describes how to get to zero emissions. Below is an example that applies to the US. A plan for China or Europe would probably be similar.
Phase I occurs between 2022 and 2029, over 7 years, and includes two components: (a) build PV solar farms and land-based wind farms at a 2.8%/yr constant decarbonization energy rate, and (b) cost-reduce technology required to decarbonize further during phase II.
Phase II occurs between 2030 and 2053, over 23 years, and involves building green energy capacity at the same 2.8%/yr rate, making use of technology developed during Phase I.
All items to the right of the above dotted blue line are currently more costly than carbon, and therefore cannot be built up significantly due to the public’s desire to avoid high energy prices. With these items, gov’t spends billions of dollars each year during Phase I, to reduce cost.
The Decarbonization Act of 2022
To implement the above plan, the USA passes The Decarbonization Act of 2022 (DA2022):
- DA2022 mandates that the USA decarbonize at a constant rate, to zero emissions, by 2052. This works out to 2.8% of total energy going green, each year, for 30 years.
- Constant rate decarbonization spreads out disruption evenly over time, and blocks the present from handing an impossible task to the future.
- Gov’t economists and engineers develop policy options that support 2.8%/yr decarbonization.
- Electricity is decarbonized first, since it is the only way to initially get 2.8%/yr at low cost. This entails transitioning 6.6% of total electricity, each year, to sources that do not emit CO2 (42% of energy is electricity, 6.6% = 2.8%/42%).
- The cheapest way to decarbonize electricity is to construct PV solar farms and wind farms at an accelerated pace. We can do this until we saturate, which means until supply exceeds demand, and we discard green electricity when sunny and windy.
- Saturation would probably occur in approximately 7 years, and at that time, we would need additional decarbonization methods to continue at the 2.8%/yr pace.
- Gov’t intervention is sized to drive 6.6%/yr solar and wind power construction. This is done with a combination of tax credits, renewable requirements, and/or direct subsidies.
- Gov’t intervention causes consumer prices to increase, and tax revenue to decrease. The sum of these two is the cost to decarbonize, and one can expect this to be between $0.005 and $0.020/kWh, until we saturate solar and wind.
- A United States Decarbonization Laboratory (USDL) is established, as soon as possible, and tasked with developing low cost technology that eventually gets us to zero emissions in 2052.
- A decarbonization tax on electricity, between $0.001 and $0.003/kWh, supports the Decarbonization Laboratory ($4B to $12B/yr).
- A new position is established, and given the authority to rework existing Power Purchase Agreements, as described in How to Accelerate Green Electricity.
USA, Europe and China All Need a Decarbonization Laboratory
During Phase I, engineers have much to do. For example, they need to develop nuclear power and 24 x 365 solar power, which are both capable of manufacturing materials and chemicals, via direct heat, cheaper than carbon-based options.
This is complicated; therefore, the US, Europe and China each need to set up their own national laboratories, tasked with solving the entire climate change problem, worldwide.
If one nation reduces CO2 emissions to zero, then harm will still come to her shores due to others not decarbonizing; therefore, each lab is tasked with solving the problem worldwide. One lab can influence other nations by giving away technology that makes green energy cheaper than carbon-based options.
The Chinese have a strong manufacturing sector that builds big, fast and cheap. The Americans are good with R&D and computers. And the Europeans are well educated and proficient with green energy. Together, these three labs figure out how to get to zero, at low cost.
For ideas on what a green lab might do, see the Aspencore Climate Change Solutions Series of articles.
Disrupt Today or Defer?
Nations might be inclined to not decarbonize at a constant pace, and instead assume technology improvements and other cost reduction measures will make it easier in the future, and defer.
If a nation does not have decarbonization opportunities cheaper than carbon (or close to it), then decarbonizing is quite difficult, and waiting till later is an understandable strategy. On the other hand, if one does have cheaper-than-carbon opportunities, they should consider decarbonizing at a constant rate, and spreading out the burden.
Decarbonizing is likely to become more difficult over time for several reasons:
- Electricity is relatively easy to decarbonize, since one can replace a carbon-based power station with a green source, without incurring changes at user. Alternatively, non-electricity requires changes at the user, of which there are many.
- Making materials via “cold” PV solar or wind, cheaper than carbon, might be impossible. On the other hand, manufacturing via direct heat, from a nuclear reactor or concentrated solar facility, cheaper than carbon, is theoretically possible. However, we are not close to doing this, especially at large scales.
- Both NREL and EIA expect technologies that are currently more-costly-than-carbon to stay that way for many decades.
Constant Rate Decarbonization?
There are different approaches to decarbonizing. Below are two examples:
- Decarbonize most of electricity over 20 years.
- Decarbonize all energy at a constant pace, focus on electricity first since it is cheap and understood, do R&D while decarbonizing electricity, and then tackle non-electricity after engineers develop low-cost remedies.
Many nations favor the first approach, whereas this article looks at the second.
The problem with the first approach is it places a large burden on later years, and it is not clear the future can handle the task. The problem with the second approach is it entails more disruption sooner.
One can mathematically calculate how much disruption an accelerated green electricity construction program would cause. At first, consumers might see a small increase in electricity prices. Later, the price of coal and natural gas fuel would probably decrease, due to less demand, and this might cause electricity prices to drop. Ultimately, pain shifts to the coal/gas supply chain, which sees lower price, and less volume. And this causes stress for their lenders, due to more debt in distress.
In a sense, if a nation does not see disruption throughout its entire energy industry, it is not decarbonizing.
A Carbon Tax Will Not Save Us
Some economist favor a carbon tax (CT) that supposedly pushes markets to fix this. A CT will not hurt; however, it will not save us for the following reasons:
- We need to cost-reduce many technologies faster than EIA/NREL projections, and this requires additional billions of dollars of gov’t money for engineering, and CT will not do this.
- One needs to resolve conflicts with existing power purchase agreements to accelerate going green, and this is not related to CT.
- In most cases, going green is not economically viable, and gov’t intervention, along with an associated consumer price increase, is need. And gov’t intervention is more precise than CT. For example, a $100/ton CT might increase price $0.04/kWh; however, in many cases, one needs $0.01/kWh of intervention, and a PPA amendment.
- A federal law that mandates gov’t intervention be sized to support a specific decarbonization rate will get economists what they are looking for from CT.
In conclusion, getting to zero requires smart gov’t policy; a federal law that mandates an annual decarbonization rate; and a public willingness to pay $0.005 to $0.020/kWh for decarbonization.